LIT Alert: Is This (May 2026) The Top?
Fast Five is on pause for the time being as earning season is largely over. See you in July!

If you know me, you know I don’t do this. I am a stay-invested, long-term, dollar cost average, trust-the-compounding kind of person. That has not changed. But right now, several signals are flashing simultaneously that I cannot ignore: long-term yields at multi-year highs, a stock market rally that is narrowing fast, and a set of macro risks that remain unresolved. I want to walk you through what I am seeing, make the bull case, and give you my honest take on what to do, whether you are sitting on cash or already invested.
What the Yield Curve Is Telling You
There has always been a tension between bond investors and equity investors. Bond investors get paid to be skeptical. Equity investors get paid to be optimistic. Right now, the bond market is sending a message that the stock market has not fully processed.
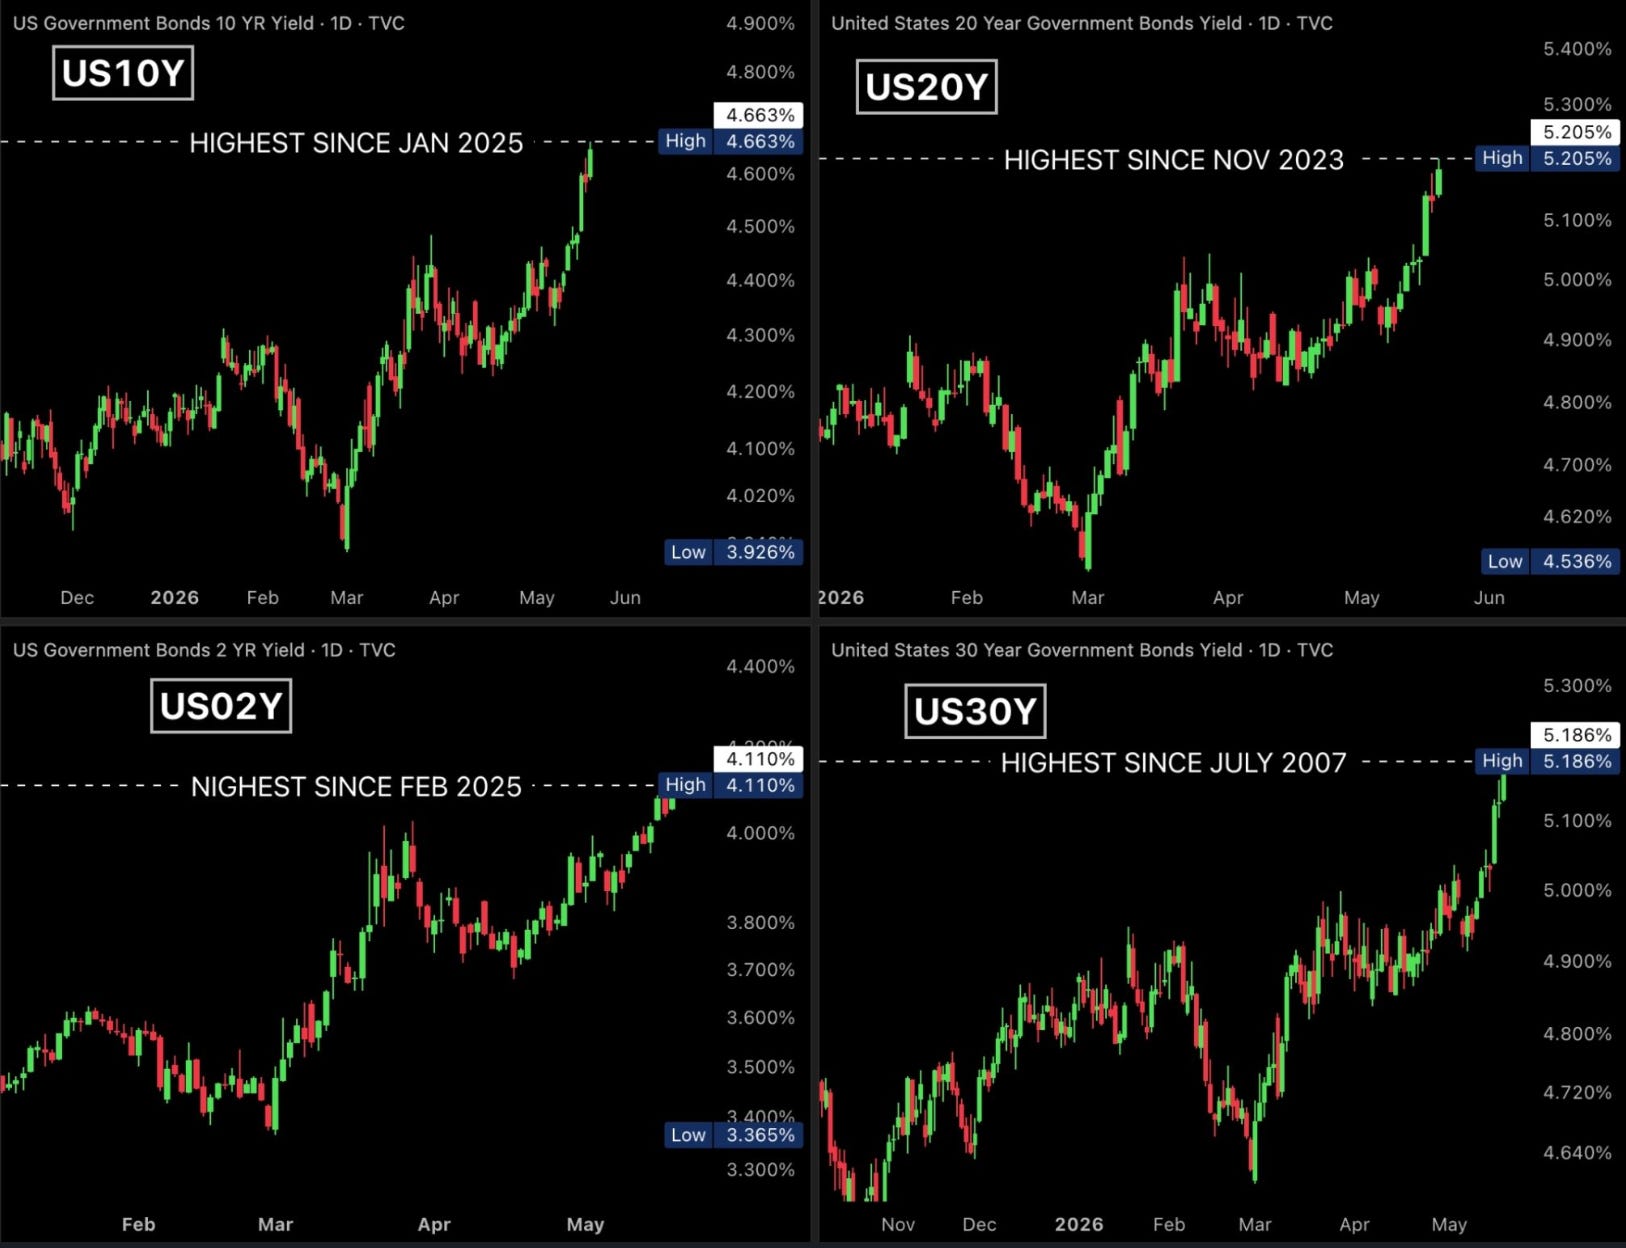
The 10-year Treasury yield has climbed to 4.663%, its highest level since January 2025. The 20-year sits at 5.205%, a level not seen since November 2023. And the 30-year has hit 5.186%. That last number is the one that should stop you cold. The 30-year has not been this high since July 2007. One year before Lehman Brothers.
To be clear: rising yields do not automatically mean a crash is coming. What they do mean is that the cost of borrowing has moved meaningfully higher across the entire duration spectrum. And when that happens, every long-duration asset gets repriced. Growth stocks, real estate, technology companies whose value lives in cash flows years down the road. When the discount rate rises, future dollars are worth less today. It is not a narrative. It is math. The transmission mechanism does not happen overnight, but that is precisely what makes it dangerous. It builds quietly, and then becomes the excuse for a selloff the moment any bad news arrives.
The bond market is bigger than the equity market. It is slow to move and hard to fake. When it moves like this, the equity market eventually listens.
Which brings us to the Federal Reserve. The next FOMC meeting is June 16 to 17. In Episode 18, we covered in depth the number the Fed actually watches, and why it matters more than the headline CPI figure most people focus on.
With inflation still running hot and the Iran conflict keeping energy prices elevated, Kevin Warsh and his team will have a very difficult time cutting rates at that meeting, or frankly anytime soon, regardless of any political pressure coming from the White House. Warsh, just confirmed as Fed Chair on May 13 in the most divisive Senate vote in Fed history, made that clear himself: he has committed to no rate decisions, and the committee around him is openly discussing rate hikes, not cuts, for later in the year. The bond market already knows this. That is what it is telling you.
The Signals Beneath the Surface
The S&P500 index says everything is fine. Look closer and the picture is different.
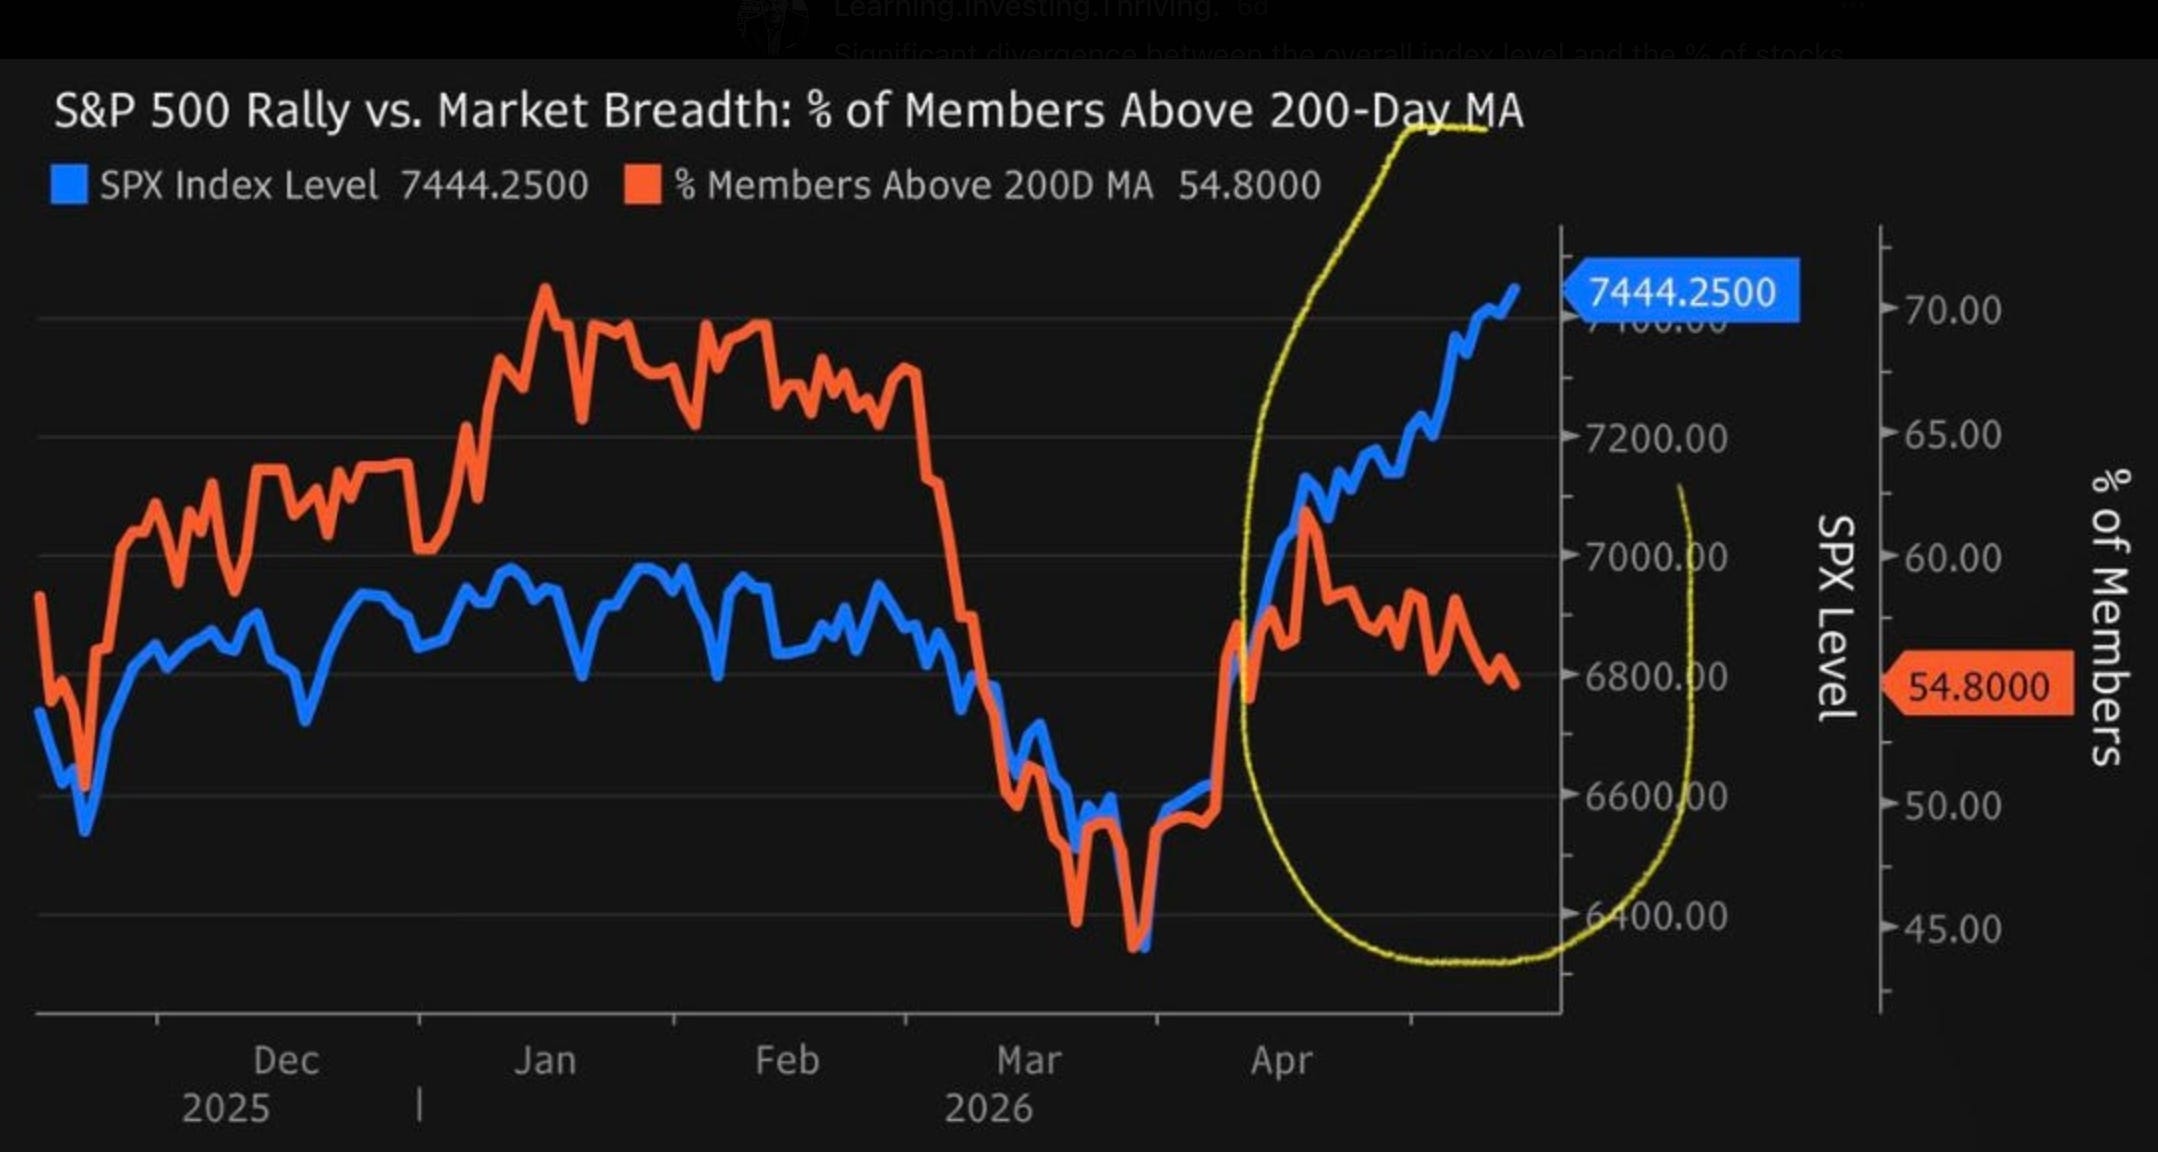
The S&P 500 closed Tuesday at 7,353, only 2% below its all-time high. But only 54.8% of its members are trading above their 200-day moving average. That means nearly half the stocks in the index are in a technical downtrend even as the headline number sits near record territory. The yellow circle on the chart below tells the story: during the April recovery, breadth moved with the index briefly, the Russell 2000 dropping 2.41% last week against the S&P’s 1.20% decline. When small caps break down at twice the rate of the index, large players are reducing risk from the most fragile end of the market outward. Regional banks piled on, losing 4.12% on the week. And defensive sectors, consumer staples and utilities, the assets institutional money is supposed to rotate into during a growth scare, caught no bid at all. Both closed red. That is the signature of a rate-driven move, not a normal correction. The rally is being carried by a shrinking group of stocks, and the rest of the market knows it.
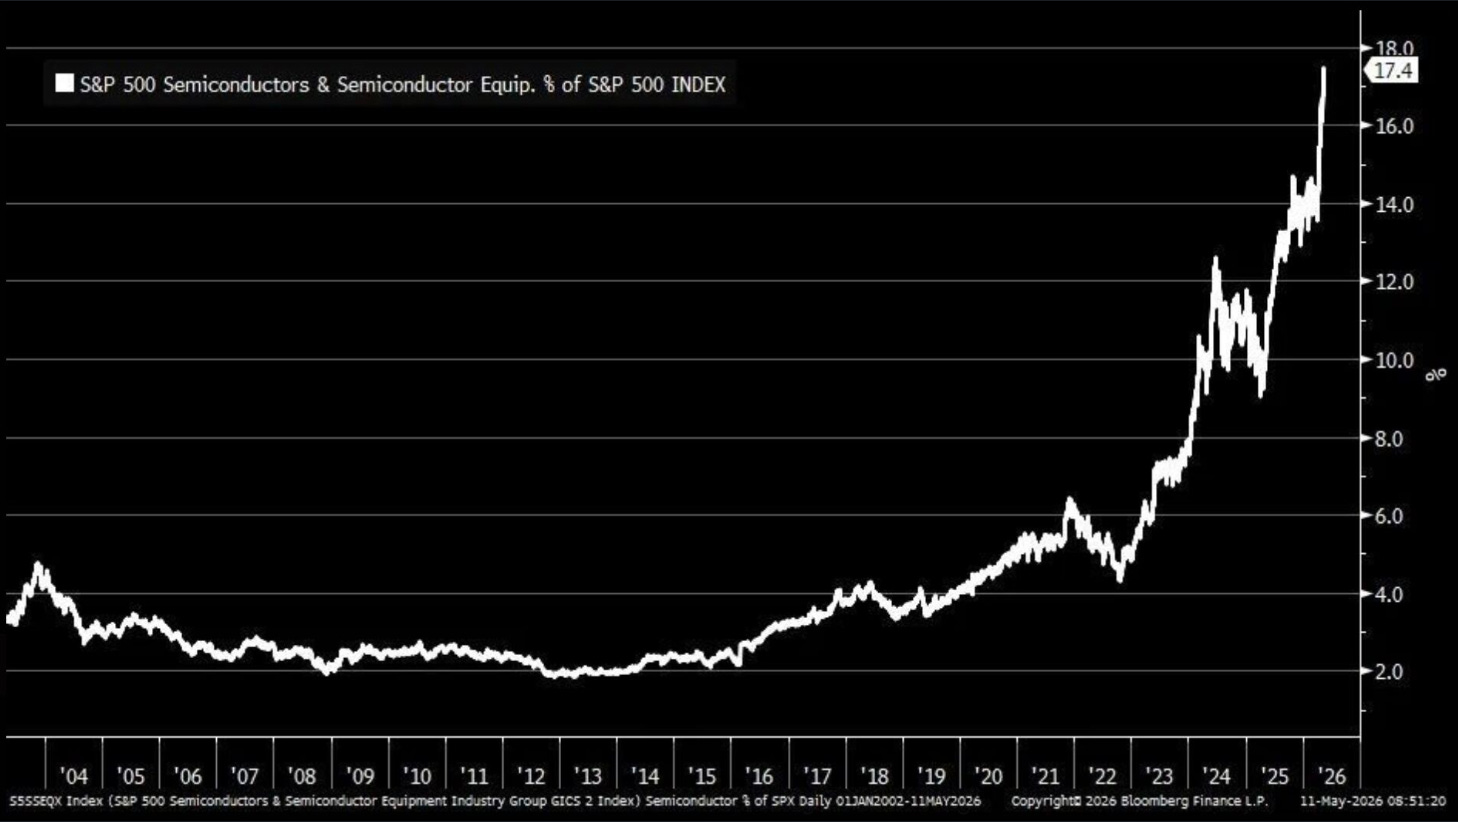
That concentration risk is visible in another chart. Semiconductors now represent 17.4% of the entire S&P 500. For most of the 2000s and 2010s, that number sat between 2% and 6%. The parabolic move higher is real and fundamental, driven by AI infrastructure spending. But it also means that any serious reset in that one sector now moves the entire index with it.
Add to that the VIX, which we covered in depth back in Episode 7.
The VIX measures how much investors are willing to pay for protection right now. It is sitting at 18, not a high absolute level. But it recently jumped 6.8% in a single day with no identifiable headline catalyst. When institutions rush to buy crash protection while the market is already going down, it tells you they were not properly hedged and scrambled to catch up.
Each of these signals individually is noise. Together they are a pattern.
The Macro Backdrop Nobody Has Solved
While markets have been recovering, three significant risks remain unresolved.
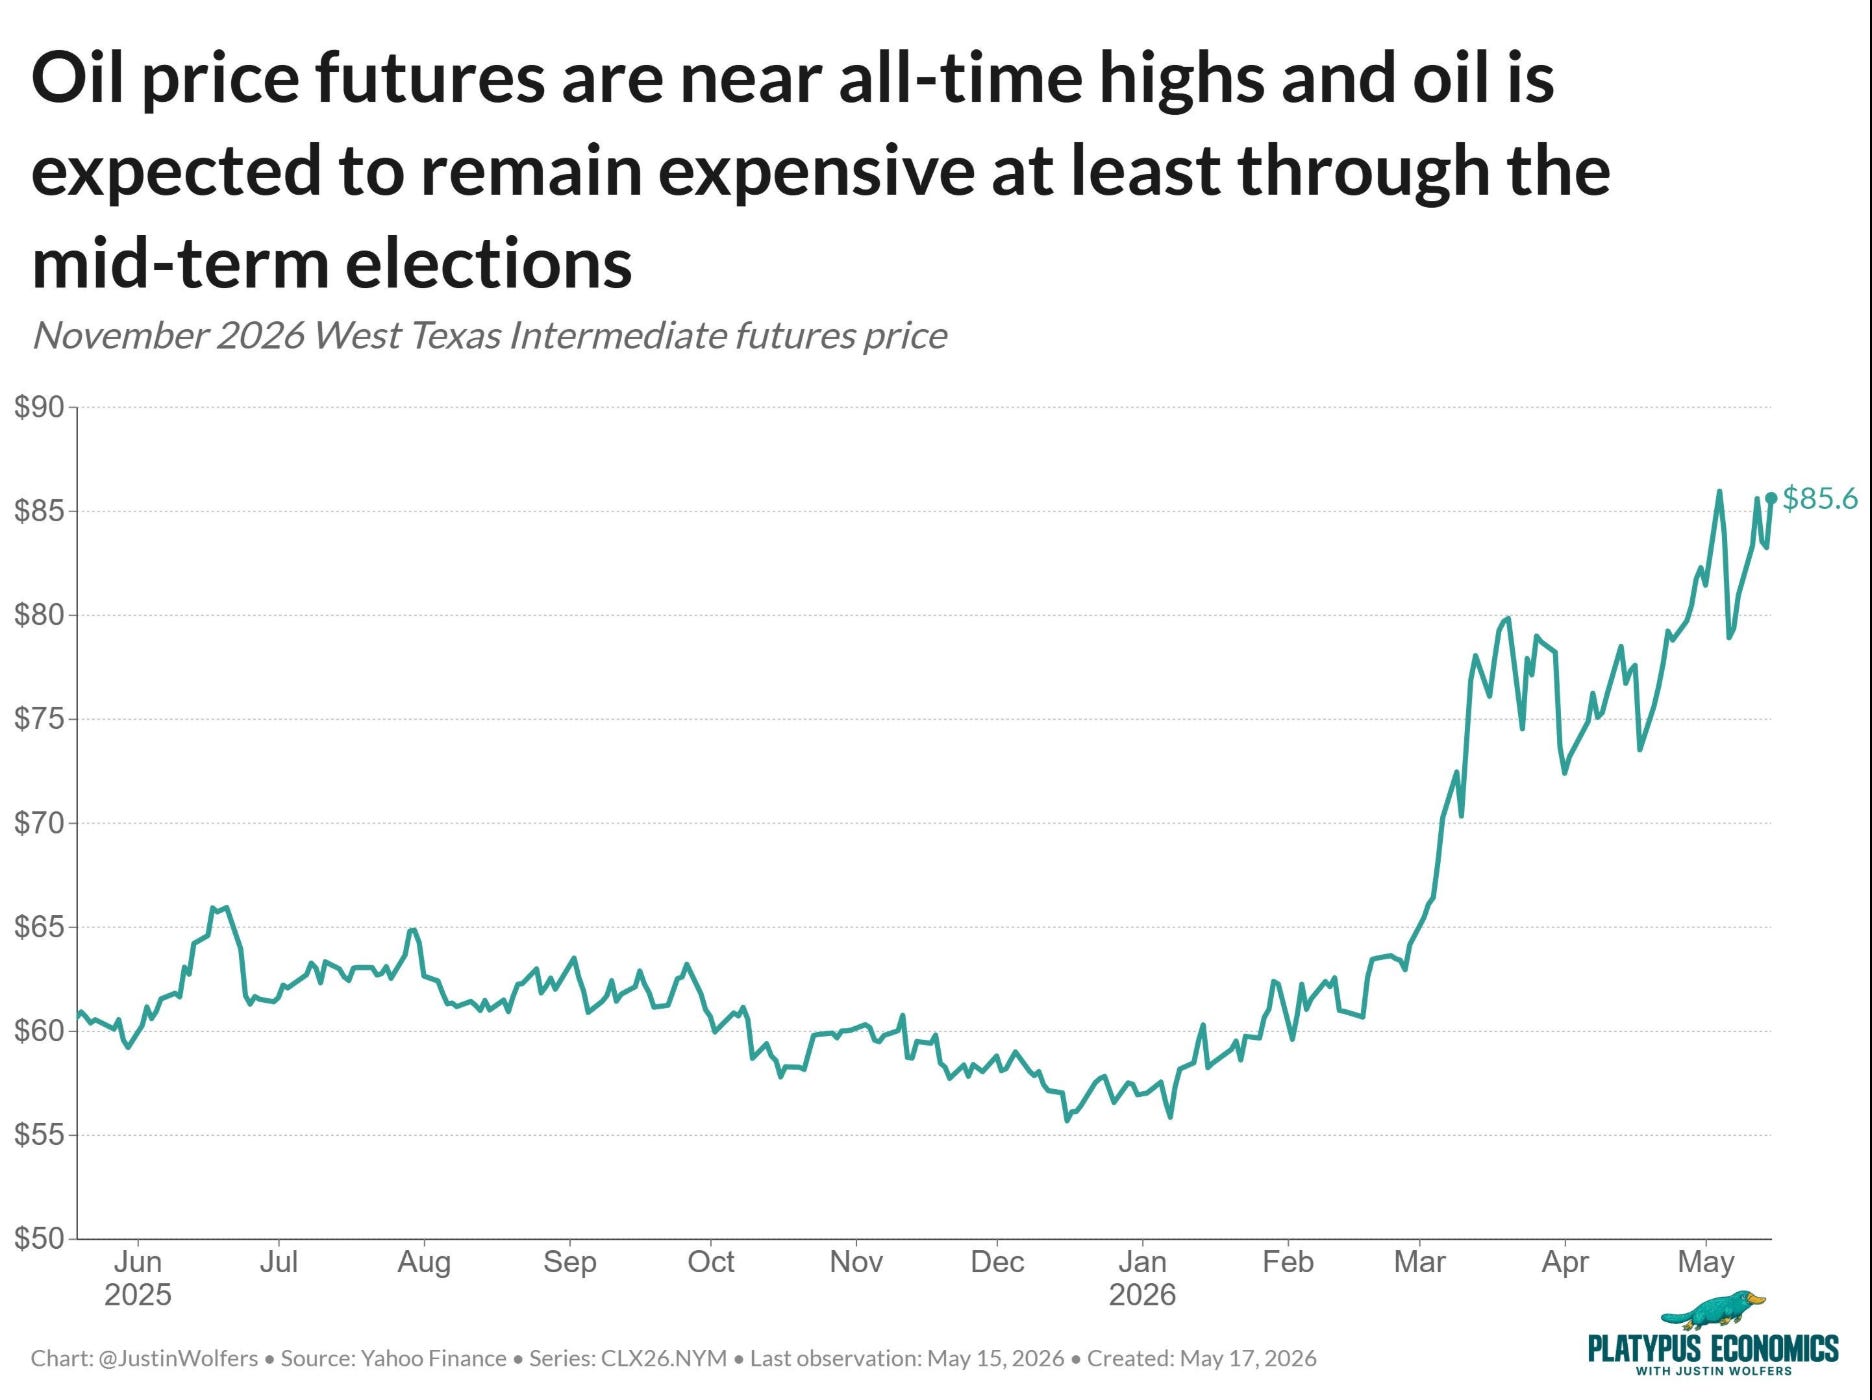
First, Iran and inflation. WTI oil futures are sitting at $85.6, near all-time highs, and the market is pricing elevated prices through at least the mid-term elections. What most people are not pricing in yet is that we may only be at the beginning of this move. In the early weeks and months of a conflict like this, companies and countries draw down raw material reserves that were accumulated when prices were low. As those reserves get replenished at higher prices, the cost impact starts to bite in earnest. We are already seeing early signs of this in the PPI data released last week. The Q1 earnings season largely predates the full cost impact. The real test will be forward guidance over the next two quarters.
Second, the US-China summit. Last week, the Trump administration flew to Beijing with every major decision-maker and CEO in tow. It was the kind of room that was supposed to produce something concrete. It did not. Nothing was agreed on tariffs, which was the one lever that could have meaningfully dampened the inflation picture. The only concrete outcomes were some incremental opening for chip sales and a handful of orders for a few of the companies in the room. The geopolitical discount is not going away anytime soon.
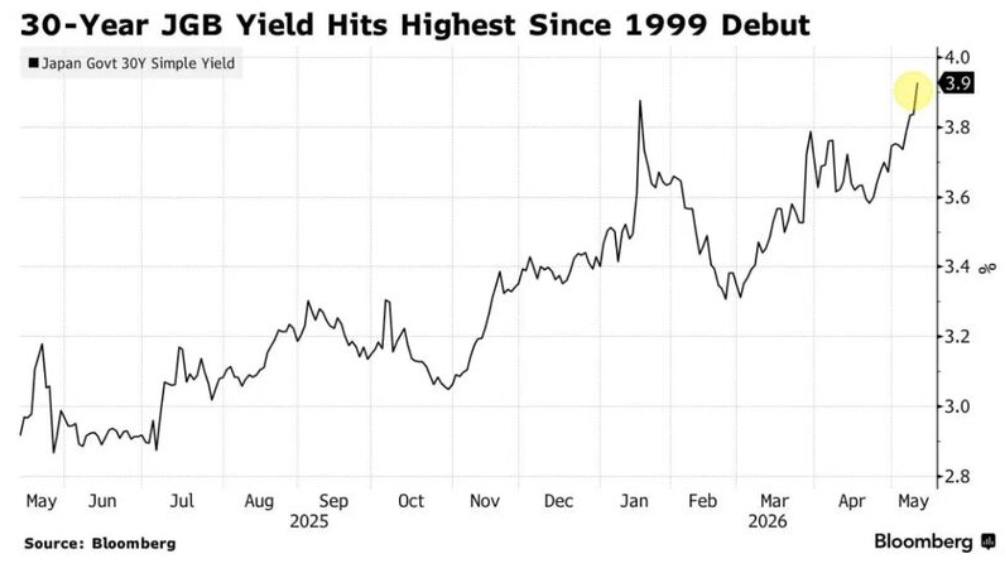
Third, Japan. This one gets the least attention and may carry the most systemic risk. The 30-year Japanese Government Bond yield just hit 3.9%, its highest level since its 1999 debut. That matters far beyond Tokyo. Japan is the largest foreign creditor to the United States, holding over $1.1 trillion in US Treasuries. As Japanese yields rise at home, Japanese investors have less incentive to park capital in US bonds. If that flow slows or reverses, it puts upward pressure on US Treasury yields at exactly the wrong time. Higher yields at home, less demand for US debt abroad, more pressure on the very rates that are already flashing warnings in Section 1. And layered on top of that is the carry trade. For years, institutions have borrowed in yen at near-zero rates and deployed that capital into US tech mega caps. The day the Bank of Japan moves decisively, the unwind begins. The same positions that drove the rally become the source of the selling. When it happens, it tends to happen fast.
Where I Could Be Wrong
Intellectual honesty matters. Here is the genuine bull case.
First, we are in an election cycle. Governments do not let markets fall in election years if they can help it. This especially true of Donald TACO Trump. Policy levers will be pulled. Liquidity will be managed. The political incentive to keep asset prices supported is as strong as it has ever been.
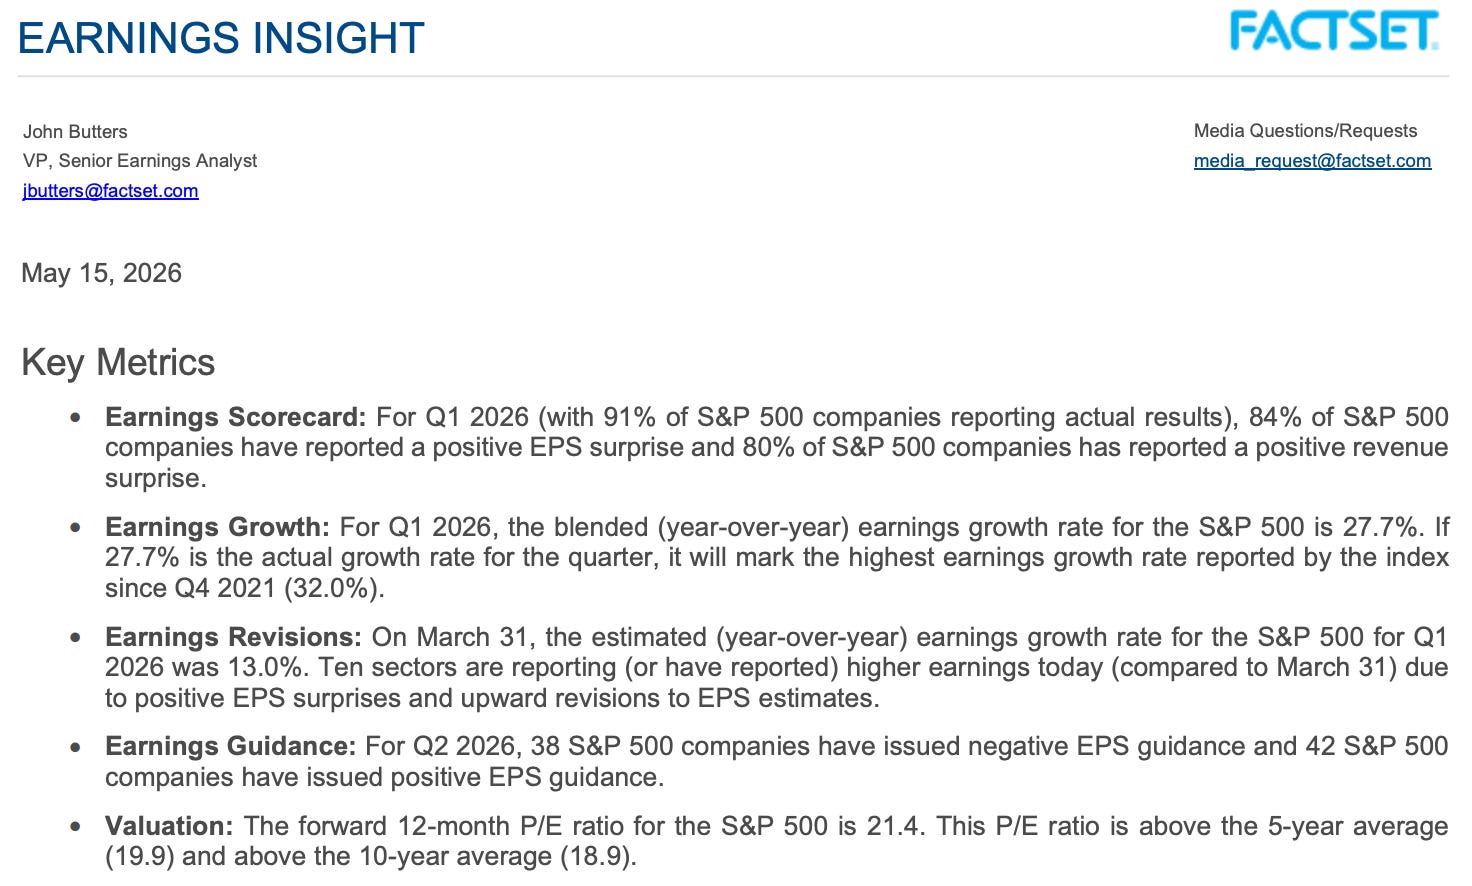
Second, this earnings season has been exceptional. We have been chronicling it week by week in Friday Five, and the numbers are not close. With 91% of S&P 500 companies having reported, according to FactSet: 84% delivered a positive EPS surprise and 80% beat on revenue, the highest combined beat rate since Q2 2021. Blended earnings growth for Q1 came in at 27.7% year over year, the strongest since Q4 2021, and more than double the 13% analysts were forecasting at the start of the year. Ten of eleven sectors revised earnings higher during the quarter. Forward guidance for Q2 is also net positive, with 42 companies issuing positive EPS guidance against 38 negative. And the AI capex story driving all of this is not slowing. Microsoft, Alphabet, Amazon, and Meta collectively committed approximately $725 billion in capex for 2026, up roughly 77% from 2025. Amazon alone guided $200 billion for the year. The fundamentals underneath this market are genuinely strong.
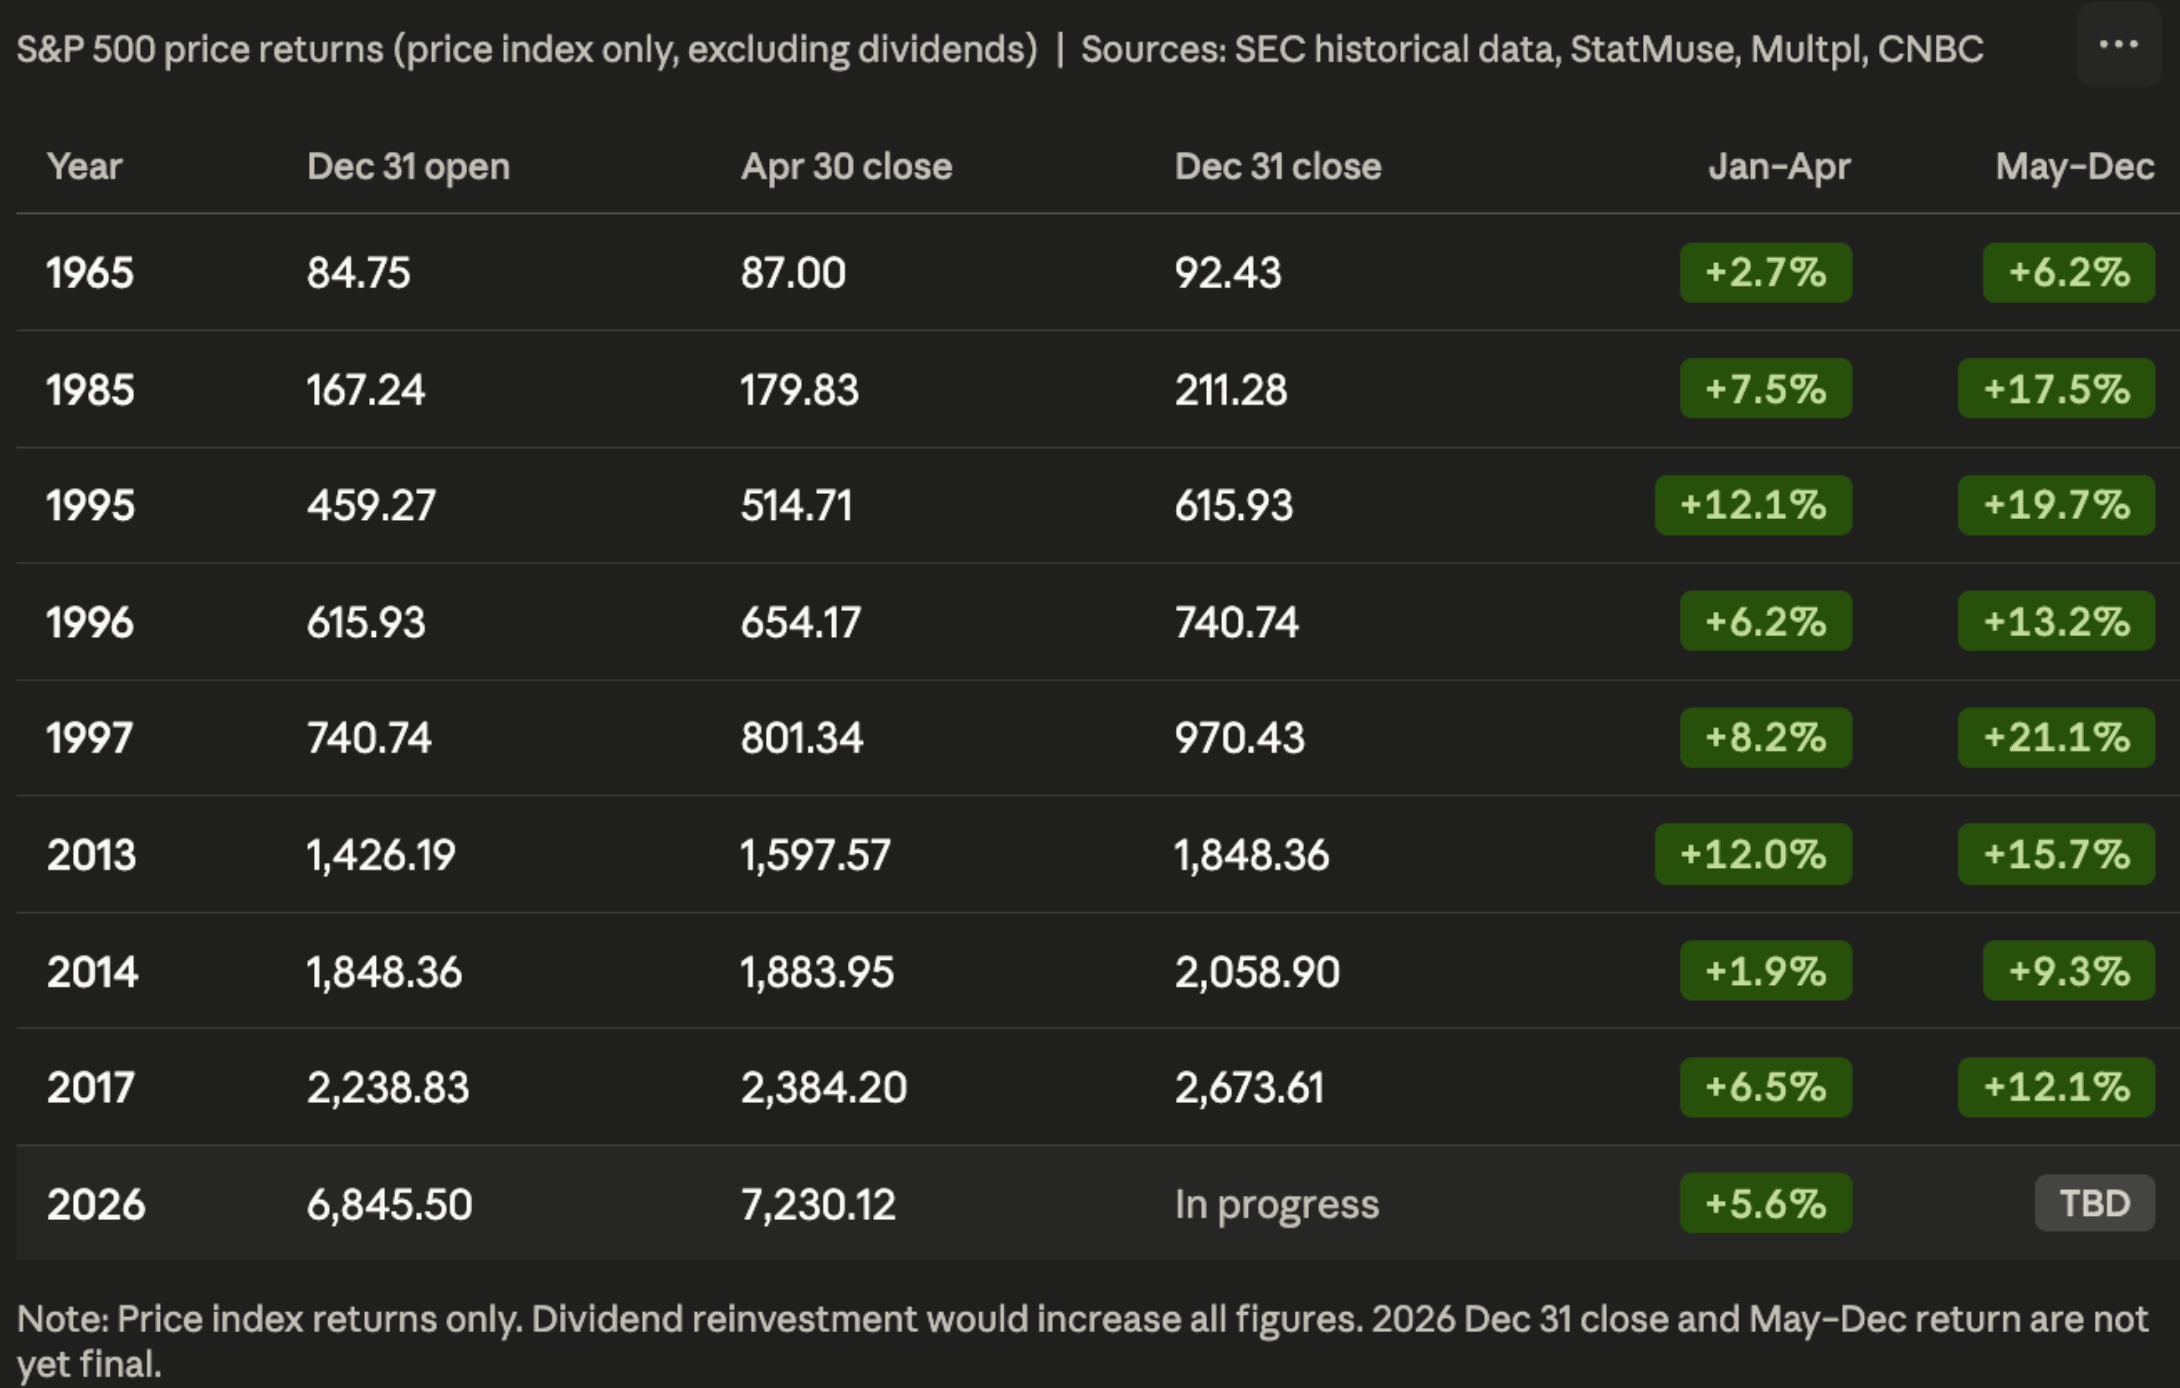
Third, the historical pattern of strong starts to the year argues for continued momentum. In every comparable year where the S&P 500 was up 5% or more through April (see table above for each year this has happened since the 1960s), the May-to-December period delivered meaningful additional gains: 1995 added 19.7%, 1997 added 21.1%, and even the more modest comparable years finished solidly. We have already hit five or more all-time highs in May alone. Multiple ATHs in a single month is a momentum confirmation signal, not a warning sign (again, see above).
What I Would Actually Do
I am not telling you to sell everything.
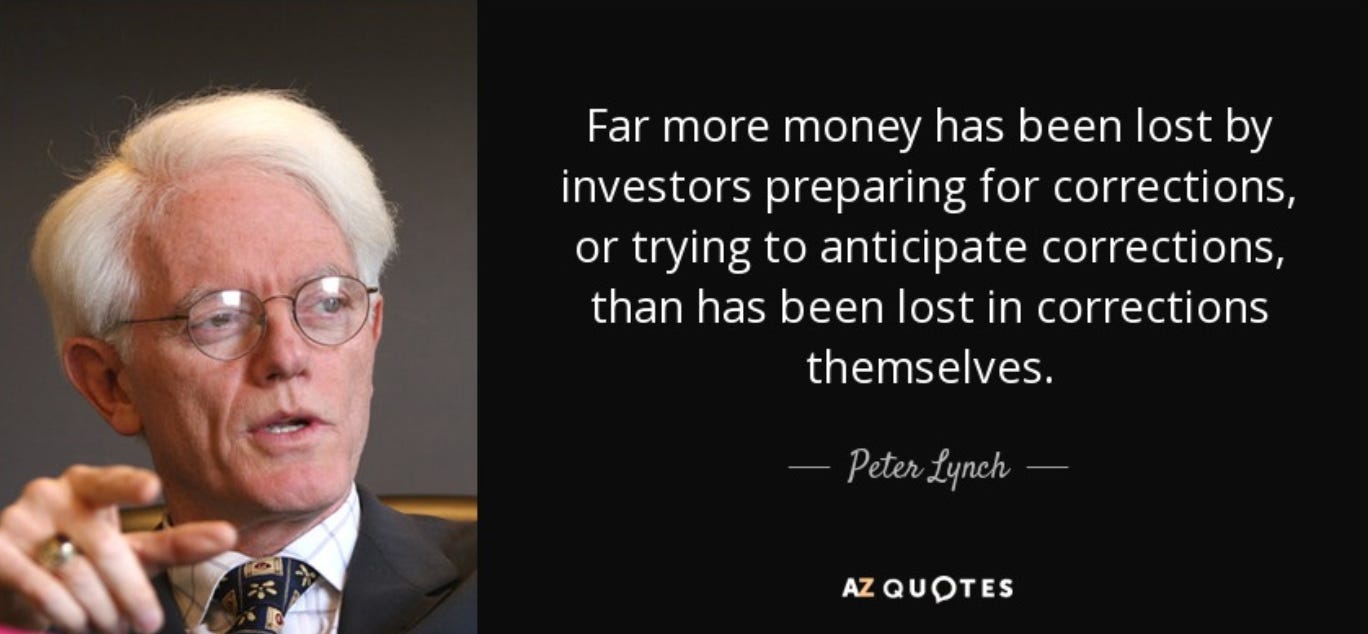
Peter Lynch put it best: far more money has been lost waiting for a correction than in corrections themselves. Trying to time the exact top is a fool’s game more often than not, and the investors who go to cash waiting for the perfect entry usually miss the next leg up entirely. For your existing holdings, stay invested.
But here is the distinction I want to make.
If you are accumulating fresh cash right now, through a paycheck, a bonus, a sale, a CD maturing, a dividend payment, anything new coming in, I would let it sit rather than deploy it immediately. The 2-year Treasury is yielding 4.11%. You are getting paid to wait. That is not a bad deal while the signals above are still flashing.
For those who want to do something with existing holdings without selling, remember what we covered in Episode 7 on the VIX. With the VIX at 18 and SKEW elevated, one option worth considering is a small position in a VIX-linked ETF as a partial hedge. Products like UVXY or VIXY move higher when volatility spikes. They are not buy-and-hold instruments, they decay over time, but as short-term protection while the signals above are unresolved, they are a tool worth knowing about. Size it small. Think of it as insurance, not a bet.
My base case is not a crash. It is either a correction in the 8% to 15% range, driven by the combination of rate pressure and narrow breadth and catalyzed by a macro headline, or alternatively the market simply takes some time to pause and digest the extraordinary run since the March lows. Either way, when better prices arrive, and I believe they do before year end, the earnings fundamentals underlying this market give you strong reason to redeploy with conviction.
Dry powder is not fear. It is strategy.
Stay Curious and Keep Learning. Investing. Thriving.
Disclaimer: The views and opinions expressed above are current as of the date of this document and are subject to change without notice. Materials referenced above are provided for educational purposes only. Nothing above constitutes investment advice, a recommendation or an offer to sell, or a solicitation of an offer to buy, any securities or investment products. Always conduct your own due diligence and consult a qualified financial professional before making investment decisions.
Wow great. Love this post